
Videor
Inspelningar, genomgångar och korta demonstrationer om planering, prognoser och scenarioanalys.
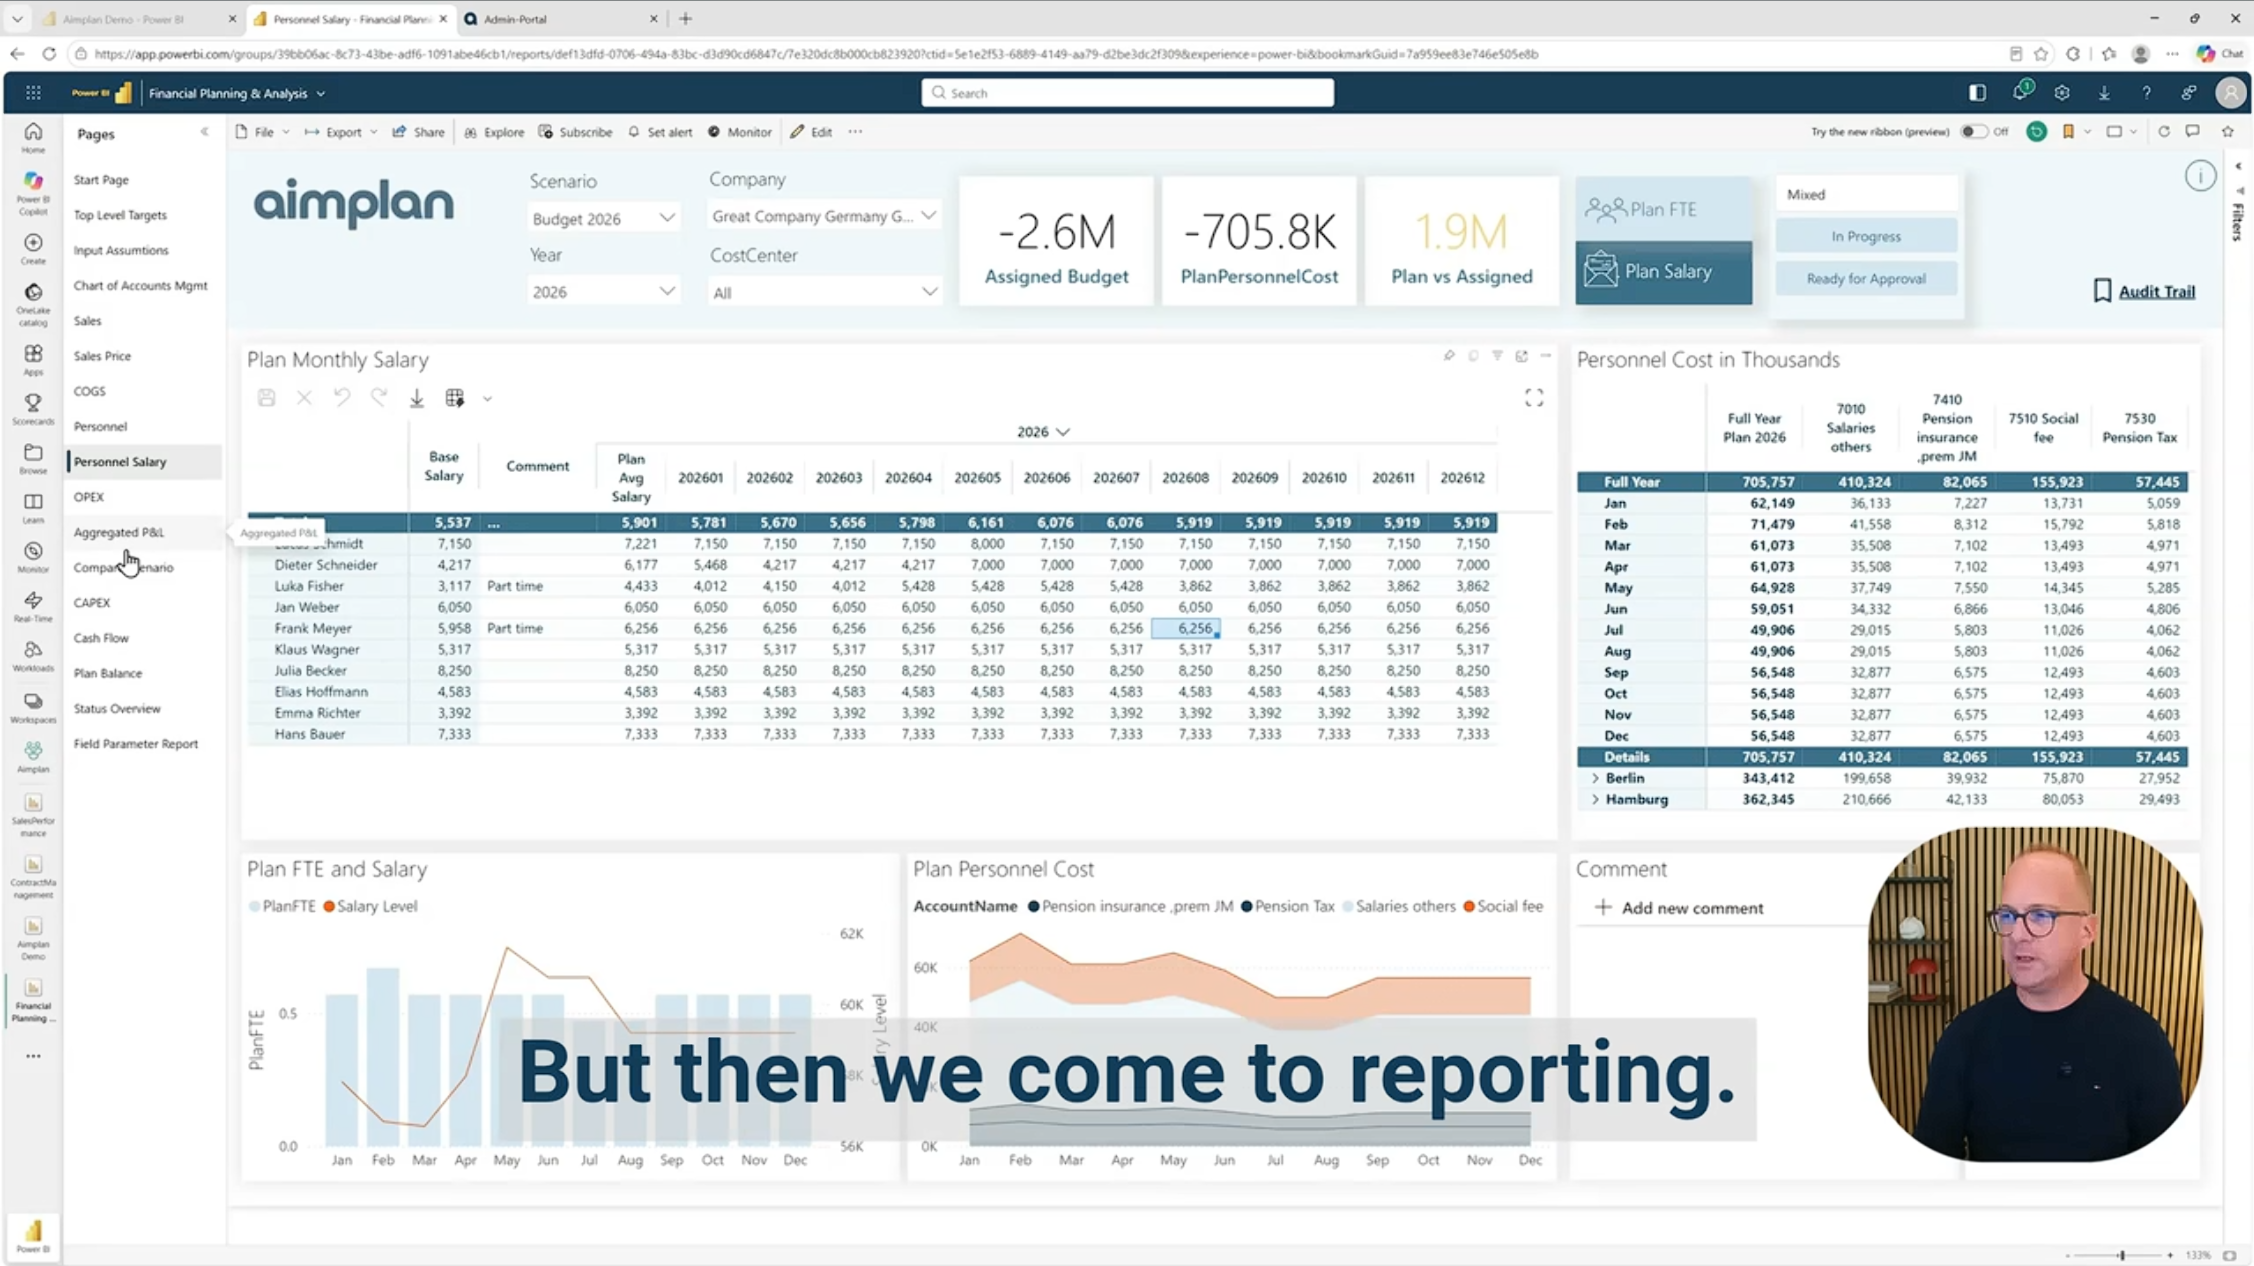
Aimplan P&L demo i Power BI
1 minut
Every company's P&L tells a different story. Different revenue streams, different cost structures, different margin logic. But most planning tools force every company into the same template. That's why finance teams spend hours reformatting exports and building workarounds just to make the report match how the business actually operates. The P&L structure should match the business. Not the other way around. With Aimplan's Planning and Reporting Visual, the finance team designs the P&L structure directly inside Power BI. Revenue, personnel costs, gross profit, gross margin. Each section follows the hierarchy that makes sense for the business, not the hierarchy the tool decided for them. Every number stays connected to the Power BI model. Drill down from any line to the transactions behind it. Everything stays inside Power BI without exports, reformatting, or workarounds.